Population Share by Major Ethnic Group
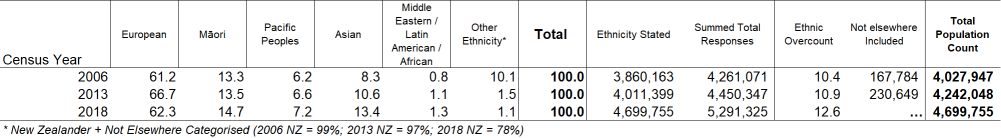
The data in these maps was originally sourced from Statistics New Zealand. Because Statistics New Zealand follows the approach of counting people into each major ethnic group they specify in the Census, the sum of total responses is somewhat greater than the population headcount. For the ‘Age Share’ and ‘Ethnic Count’ maps we have used summed total responses as the denominator in order to generate meaningful percentages (i.e. percentages sum to 100%). As Table 1 shows, in 2006, summed total responses for New Zealand (4,261,071) exceeded the headcount of those who stated their ethnic group (3,860,163) by 10.4%. In 2013 and 2018 the ‘ethnic overcount’ was respectively 10.9% and 12.6%. Stated differently, had we used the ‘ethnicity-stated’ headcount as the denominator, the national shares for each ethnic group would have summed to 110.4%, 110.9% and 112.6% respectively. Another way of looking at the data is to say that in 2006, 10.4% of people who stated their ethnic group stated more than one ethnic group; in 2013, 10.9% did so, and in 2018, 12.6%.
Table 1: Population share (%) by major ethnic group and related data, 2006, 2013, 2018
There are three sets of ethnic composition maps accessible from this page. The first set (‘Age Share’) shows the percentage of each broad age group in each territorial authority area that identified as belonging to one of New Zealand’s four major ethnic groups at the 2013 Census. The second set (‘Ethnic Share’) is based on Statistics New Zealand’s (2015) medium variant projections by major ethnic group for the years 2013, 2023 and 2038 (note that these projections are due to be updated). The third set (‘Ethnic Overcount’) shows the extent to which the projected total number of responses (all ethnic groups combined) for the three broad age groups exceed the projected head count for those age groups, in each territorial authority area.
The ‘Age Share’ and ‘Ethnic Share’ maps are labelled ‘percent share’, by which is meant that all data for each individual age group in the first set of maps sum to 100 across all ethnic groups, and data for all ethnic groups combined in the second set of maps similarly sums to 100, for each period. That is, in each case, the denominator is the summed total responses for each category. By contrast, the ‘Ethnic Overcount’ maps use the ‘head count’ as the denominator, in order to show the extent to which responses exceed head count.
The data by age for 2013 clearly show that European New Zealanders account for the dominant share of total responses at all ages, and this is especially noticeable at 65+ years; however, this is closely followed by substantial shares of Māori in many North Island territorial authority areas, especially among younger age groups. Notably, the South Island is disproportionately European at all ages.
The projections by ethnic group indicate that the South Island will continue to be predominantly European, although the Māori and Asian ethnic groups are each projected to increase their share. Across the North Island territorial authority areas, Māori also see an increased share in many areas, while Europeans see a concomitant decrease.
The ethnic overcount maps show that overcount is greatest at the younger ages because children are far more likely than their parents and grandparents to have been born into a multi-ethnic relationship; by contrast, ethnic overcount is minimal at 65+ years of age. Because of this, ethnic overcount is projected to increase over time. At territorial authority area and regional council level, ethnic overcount is greater, the higher the proportion Māori. As a result, there is an ethnic overcount gradient which runs from north to south, with jurisdictions in the North Island (where the proportions Māori are highest) having the highest measures of ethnic overcount, and those in the South Island having the lowest.
Ethnic Overcount Methodology
As indicated above, in order to convert data by ethnicity to population (percentage) shares, the issue of ‘ethnic overcount’ first has to be considered. In 2013, for example, just over half of the 598,602 usually resident Census night population identifying as Māori specified more than one ethnic group (Statistics New Zealand 2013, p5). When considered against the total population head count who stated their ethnicity for 2013 (4,011,399), Māori accounted for 14.9 per cent. While this approach accurately reflects social diversity, when all ethnic group responses are summed in this way, the resulting proportions sum to 110.9 per cent—that is, the population head count is exceeded by 10.9 per cent (another way of looking at it is to say that 10.9 per cent of people stated more than one ethnic group). This makes interpretation of the data difficult, because it is confusing when percentages (which mean ‘per hundred’) sum to more than 100. Another common approach, based on summing the responses (for the denominator) and recalculating the percentages, as we do here for these maps, resolves the problem, but may not adequately reflect the underlying social diversity. When analysed in this way, Māori in 2013 accounted for 13.5 per cent of total responses.
Statistics New Zealand (2005: 8) explains that: [t]otal response ethnicity data should be used wherever possible. This output method counts every ethnic group that a person identifies with. This is consistent with how people report their identity in so far as people of two or more different ethnicities consider themselves to be members of each of the identified ethnicities. People with responses which fall into more than one group are counted once in each group with which they identified themselves. For example, people of Samoan, Tongan and German ethnicities would be counted (when outputting at the highest level of the classification) once in the Pacific category and once in the European one. This means that the sum of the ethnic groups will be greater than the number of people.
According to Statistics New Zealand (2005: 9): [t]he advantage of total responses is that the relative size of the groups within the population is fairly represented (using as the denominator only the count of people for whom ethnicity is available). The proportion of a group which overlaps with other groups may be large and reflects social diversity. The overlap however is only observable at a high level and in order to gain an understanding of such overlapping, single/combination analysis may be required. Single/combination ethnicity data provides much more detailed information. It also has the advantage that the sum of the categories is the same as the count of people who specified ethnicity. The overlaps between ethnic groups is often significant. Any analysis of a population should include an understanding of the relationship between ethnic groups and such overlaps. For example, people who identify themselves with two groups may possess different characteristics from people who belong to one of those groups but not the other. Therefore, when used in conjunction with total response data, single/combination data provides useful information on the components of ethnic groups. This is a very powerful method for identifying diversity and dynamics within and between groups, and it has the potential to assist in explaining trends. The disadvantage with single/combination data lies in the large number of potential categories.
We do not pursue here the issue of which approach is better, but instead encourage users of ethnic group data to carefully read the relevant information on Statistics New Zealand’s website (see also reference list below). Here we simply draw attention to the diverse nature of ethnic overcount by age and at subnational level.
Further reading
Cochrane W and I Pool (2017) Māori in New Zealand’s contemporary development Policy Quarterly Supplement 13: 47-54. http://igps.victoria.ac.nz/publications/PQ/2017/PQ-Vol-13-Supplementary-2017.pdf.
References
Statistics New Zealand (2020) Territorial authority data about individuals for all New Zealand, Table 5, 2006, 2013 and 2018.
Statistics New Zealand (2013). 2013 Census QuickStats about Māori. Available from www.stats.govt.nz.
Statistics New Zealand (2005) Understanding and working with ethnicity data. A technical paper.
Statistics New Zealand (nd). The Statistical Standard for Ethnicity and When Individual Responses Exceed Input Storage - A Procedure For Unbiased Reduction. A technical paper for software developers.