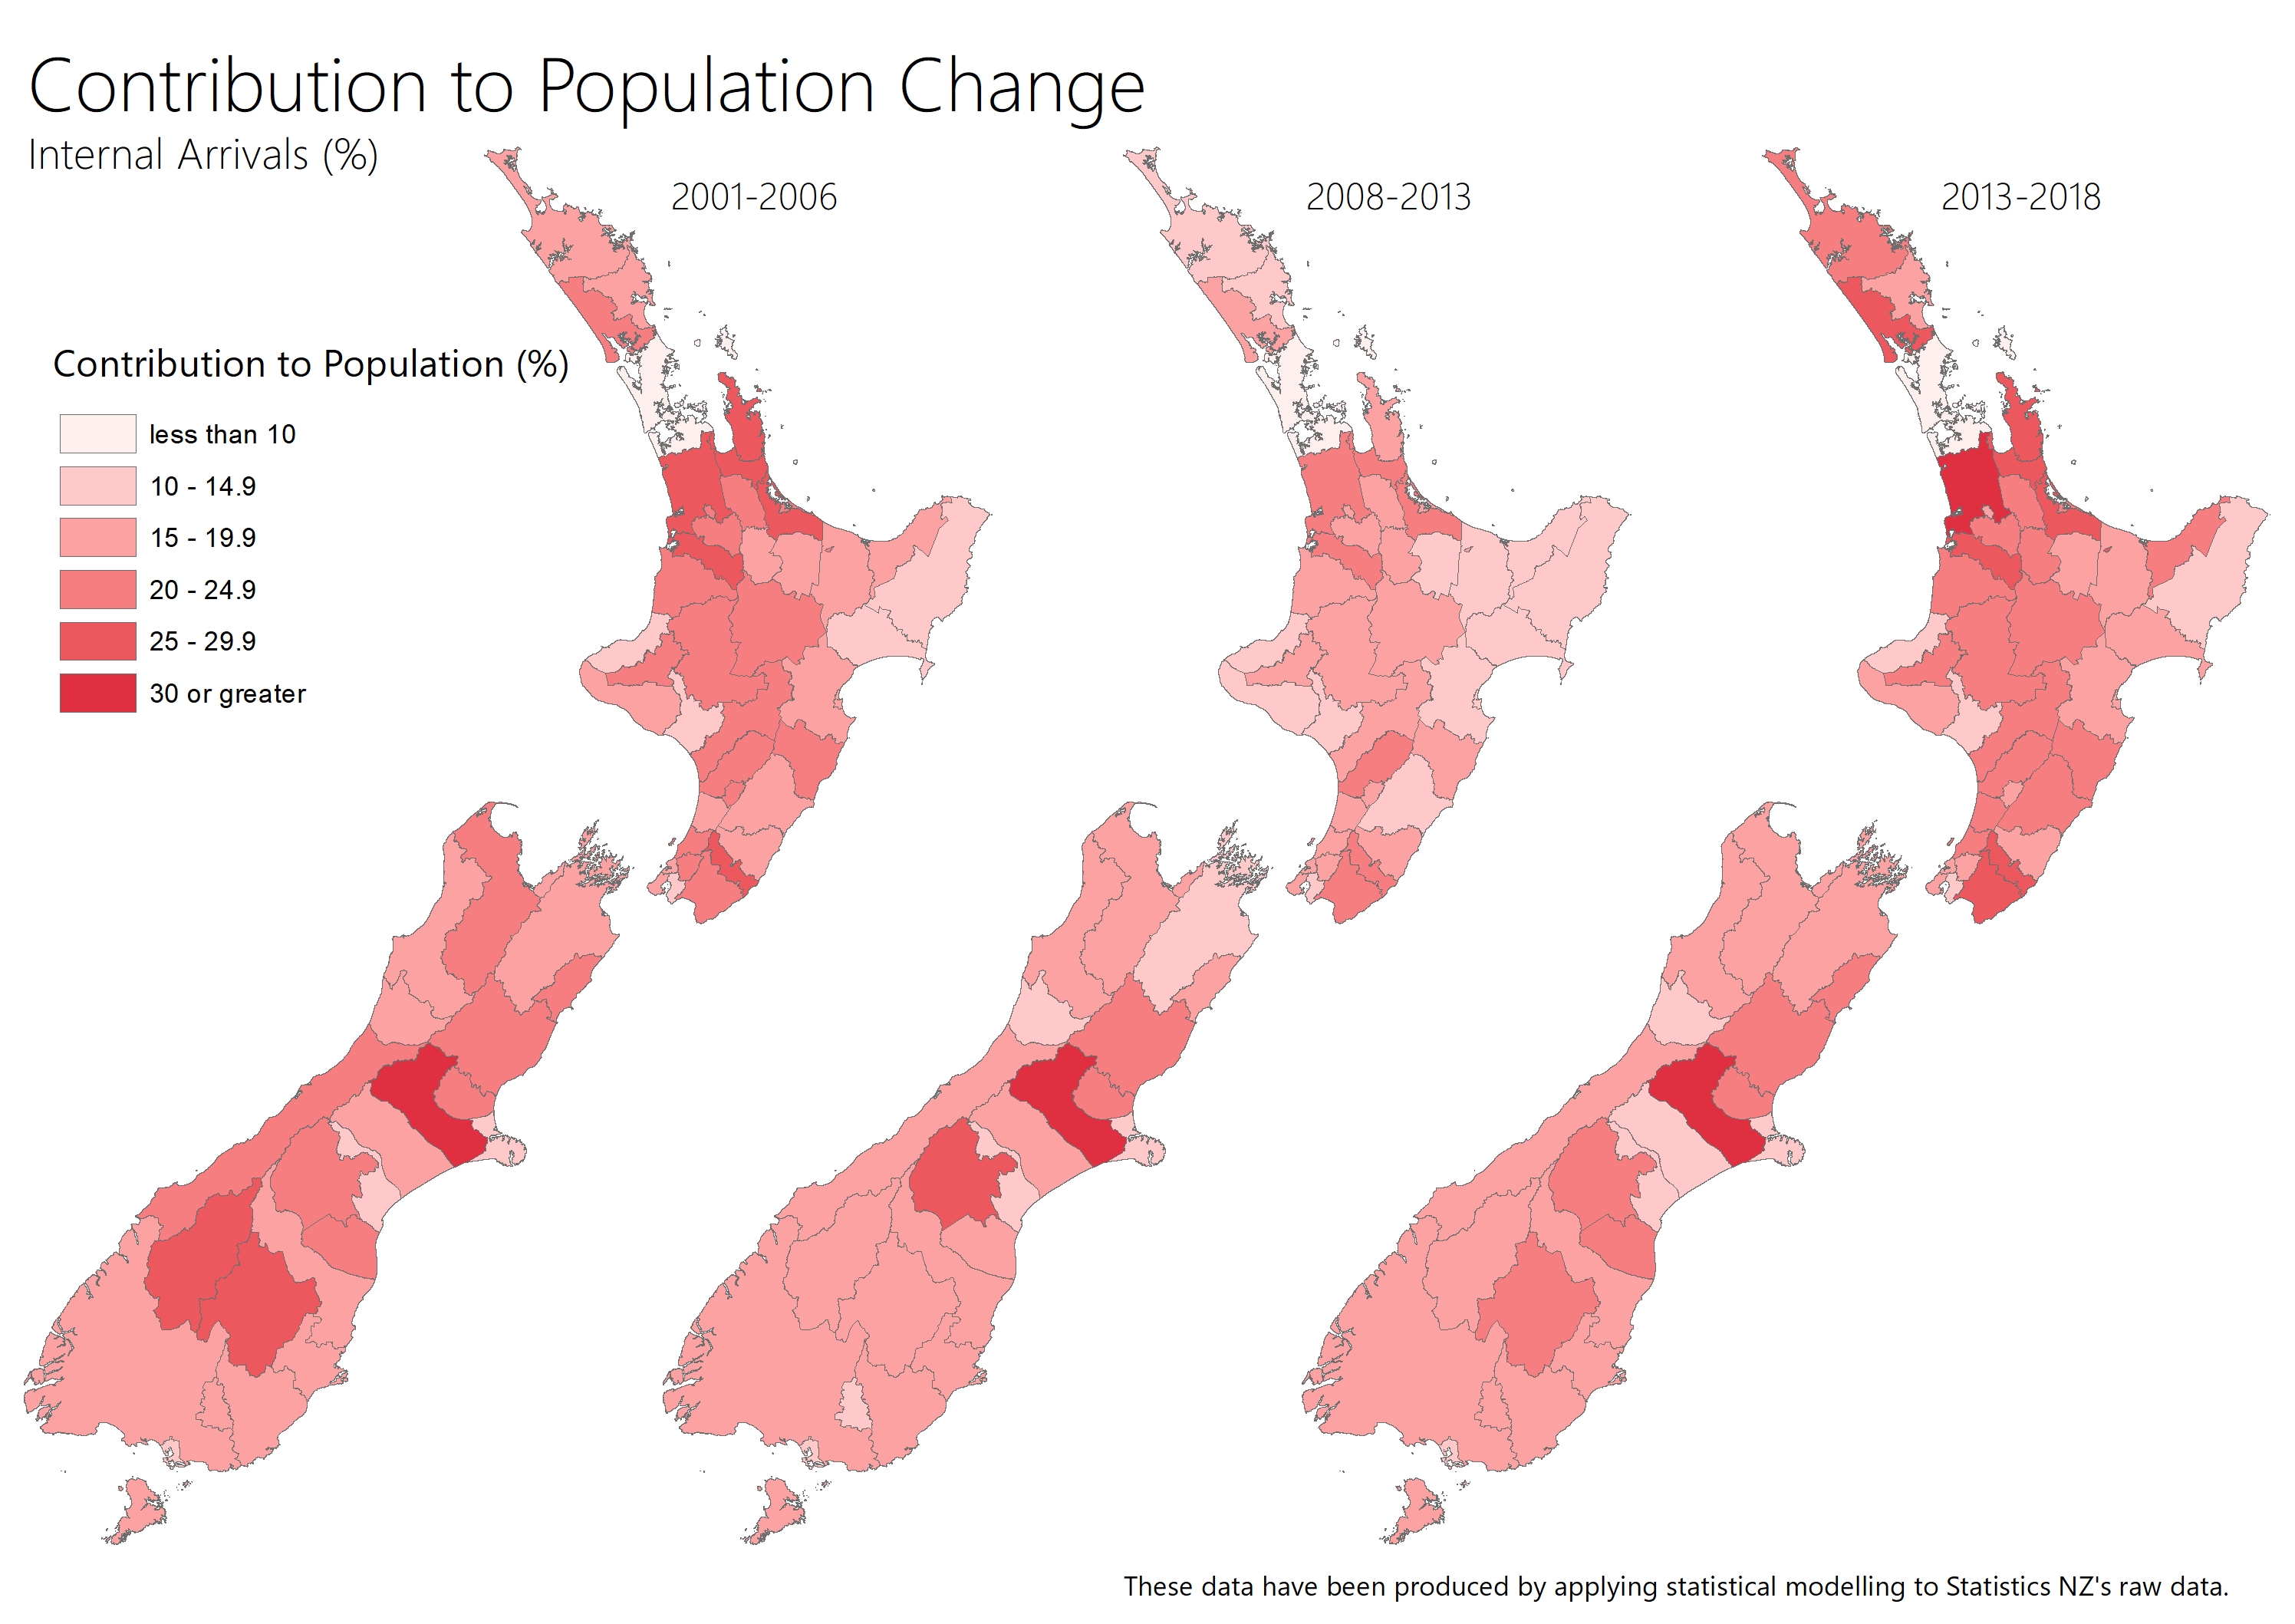
These maps show the percentage contribution of each component of population change to the Census Usually Resident Population of each territorial authority area, for the periods 1996-2001, 2001-2006, 2008-2013 and 2013-2018. The data to 2013 are drawn from the MBIE project Nga Tangata Oho Mairangi (NTOM) and have been converted for visualisation by the CaDDANZ Population Atlas research team. Data and maps for the 2013-2018 period have been developed as part of the CaDDANZ project. See for methodology.